java-he
- 浏览: 168802 次
- 性别:

- 来自: 北京
-

文章分类
- 全部博客 (186)
- [网站分类]4.其他技术区 (93)
- [网站分类]6.转载区(Java技术文章转载, 请注明原文出处) (4)
- [网站分类]3.非技术区 (7)
- [网站分类]1.网站首页原创Java技术区(对首页文章的要求: 原创、高质量、经过认真思考并精心写作。BlogJava管理团队会对首页的文章进行管理。) (28)
- HTML&CSS (0)
- 感悟生活 (4)
- c#(.net) (1)
- [网站分类]2.Java新手区 (32)
- [网站分类]5.提问区(Java方面的技术提问) (1)
- java (6)
- web前端 (7)
- php (0)
- C++ (1)
- python (0)
- 互联网应用 (0)
最新评论
-
lliiqiang:
请求单线程资源只能等待结果.
Applet 与JS通信 -
feng2qin:
期待你的精彩回到。QQ:864479410
Applet 与JS通信 -
feng2qin:
我想问一句;哥们儿,applet程序中调用js,你真的成功了嘛 ...
Applet 与JS通信 -
lyaixsp:
...
ExtJS 入门学习之 window与panel篇 -
longzijian:
不知道 java-he 现在找到数组的这种特性 的原因在那里
和网友关于javascript数组的讨论
系列1、2中介绍过的内容在这里不会赘述。
原理同面1、2基本一样。
1
 <!
DOCTYPE html PUBLIC "-//W3C//DTD XHTML 1.0 Transitional//EN" "http://www.w3.org/TR/xhtml1/DTD/xhtml1-transitional.dtd"
>
<!
DOCTYPE html PUBLIC "-//W3C//DTD XHTML 1.0 Transitional//EN" "http://www.w3.org/TR/xhtml1/DTD/xhtml1-transitional.dtd"
>
2
<
html
xmlns
="http://www.w3.org/1999/xhtml"
>
3
<
head
>
4
<
meta
http-equiv
="Content-Type"
content
="text/html; charset=utf-8"
/>
5
<
title
>
TEST
</
title
>
6
<
script
type
="text/javascript"
src
="wz_jsgraphics.js"
></
script
>
7
<
script
type
="text/javascript"
src
="line.js"
></
script
>
8
</
head
>
9
<
body
>
10
<
p
>
1.线图
</
p
>
11
<
div
id
="LineDiv"
style
="position:relative;height:200px;width:300px;"
></
div
>
12
 <
script
language
="javascript"
>
<
script
language
="javascript"
>

13 var
y
=
new
Array ();
var
y
=
new
Array ();
14 y[
0
]
=
16000
;
15 y[
1
]
=
1000
;
16 y[
2
]
=
20000
;
17 y[
3
]
=
100
;
18 y[
4
]
=
-
500
;
19 y[
5
]
=
9000
;
20
var
x
=
new
Array ();
21 x[
0
]
=
"
a
"
;
22 x[
1
]
=
"
b
"
;
23 x[
2
]
=
"
c
"
;
24 x[
3
]
=
"
aa
"
;
25 x[
4
]
=
"
bb
"
;
26 x[
5
]
=
"
dd
"
;
27
var
myline
=
new
Line(
"
LineDiv
"
);
28 myline.drawXYLine(y,x);
29 //
myline.clearLine();
//
myline.clearLine();
30
</
script
>
31
</
body
>
32
</
html
>
<!
DOCTYPE html PUBLIC "-//W3C//DTD XHTML 1.0 Transitional//EN" "http://www.w3.org/TR/xhtml1/DTD/xhtml1-transitional.dtd"
>
2
<
html
xmlns
="http://www.w3.org/1999/xhtml"
>
3
<
head
>
4
<
meta
http-equiv
="Content-Type"
content
="text/html; charset=utf-8"
/>
5
<
title
>
TEST
</
title
>
6
<
script
type
="text/javascript"
src
="wz_jsgraphics.js"
></
script
>
7
<
script
type
="text/javascript"
src
="line.js"
></
script
>
8
</
head
>
9
<
body
>
10
<
p
>
1.线图
</
p
>
11
<
div
id
="LineDiv"
style
="position:relative;height:200px;width:300px;"
></
div
>
12
<
script
language
="javascript"
>
13
var
y
=
new
Array ();14
y[
0
]
=
16000
;15
y[
1
]
=
1000
;16
y[
2
]
=
20000
;17
y[
3
]
=
100
;18
y[
4
]
=
-
500
;19
y[
5
]
=
9000
;20
var
x
=
new
Array ();21
x[
0
]
=
"
a
"
;22
x[
1
]
=
"
b
"
;23
x[
2
]
=
"
c
"
;24
x[
3
]
=
"
aa
"
;25
x[
4
]
=
"
bb
"
;26
x[
5
]
=
"
dd
"
;27
var
myline
=
new
Line(
"
LineDiv
"
);28
myline.drawXYLine(y,x);29
//
myline.clearLine();
30
</
script
>
31
</
body
>
32
</
html
>
效果图: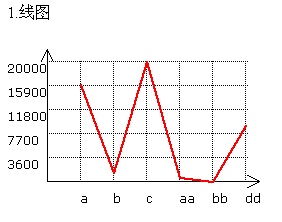
1
/**/
/*
************更多技术文章请访问:http://www.blogjava.net/JAVA-HE****************
2 *
3 * 文件名:line.js V 1.01
4 *
5 * 作 者:何昌敏
6 *
7 * 时 间:2007-7
8 *
9 * 描 述:绘制坐标曲线图
10 *
11 * 备 注:
12 * 1.实现了根据所提供数据,自动标刻y轴坐标。
13 * 2.实现了图像清除。
14 * 3.调整startx starty能实现整体位置调整。
15 *
16 * 感 谢:Walter Zorn提供了API ——wz_jsgraphics.js v. 3.01。
17 *
18*************更多技术文章请访问:http://www.blogjava.net/JAVA-HE***************
*/
19
20
function
Line(obj)
21
{
22
this
.jg
=
new
jsGraphics(obj);
23
var
colors
=
new
Array();
24 colors[
0
]
=
"
#0066FF
"
;
25 colors[
1
]
=
"
#FF6633
"
;
26 colors[
2
]
=
"
#9900FF
"
;
27 colors[
3
]
=
"
#FF0066
"
;
28 colors[
4
]
=
"
#066600
"
;
29 colors[
5
]
=
"
#006633
"
;
30 colors[
6
]
=
"
#33FFFF
"
;
31 colors[
7
]
=
"
#000000
"
;
32 colors[
8
]
=
"
#FFFF00
"
;
33 colors[
9
]
=
"
#000033
"
;
34 colors[
10
]
=
"
#CCFFFF
"
;
35 colors[
11
]
=
"
#666666
"
;
36
this
.start_x
=
40
;
//
应大于等于y_str_width
37
this
.y_str_width
=
40
;
//
坐标系的左边距
38
this
.x_str_tom
=
10
;
//
x轴文字 距离坐标系底部距离。
39
this
.start_y
=
20
;
//
>=this.ArrowLength*2 箭头的高度
40
this
.width
=
200
;
41
this
.height
=
120
;
42
this
.y_line_num
=
5
;
43
44
this
.IsDrawArrow
=
true
;
45
this
.ArrowLength
=
6
;
46
47
this
.drawXYLine
=
function
(_y,_x)
48
 {
{
49
var
y_length
=
_y.length;
50
var
x_length
=
_x.length;
51
if
(y_length
!=
x_length)
52
{
53 alert(
"
X and Y length of inconsistencies, errors parameters.
"
);
54
return
;
55 }
}
56
var
y_line_distance
=
Math.round(
this
.height
/
this
.y_line_num);
57
var
x_line_distance
=
Math.round(
this
.width
/
x_length);
58
59
this
.jg.drawLine(
this
.start_x,
this
.start_y
+
this
.height,
this
.start_x
+
this
.width,
this
.start_y
+
this
.height);
//
x
60
this
.jg.drawLine(
this
.start_x,
this
.start_y
+
this
.height,
this
.start_x,
this
.start_y);
//
y
61
this
.jg.setStroke(Stroke.DOTTED);
62
var
_y_copy
=
_y.concat();
63
var
temp
=
_y;
64 temp.sort(
function
AscSort(x, y)
65
{
66
return
x
==
y
?
0
: (x
>
y
?
1
:
-
1
);
67 }
68 );
69
var
y_max2y_min
=
temp[x_length
-
1
]
-
temp[
0
];
70
var
y_min
=
temp[
0
];
71
var
y_value_distance
=
y_max2y_min
/
this
.y_line_num;
72
for
(
var
i
=
0
;i
<
this
.y_line_num;i
++
)
73
{
74
var
y_item
=
this
.start_y
+
this
.height
-
(i
+
1
)
*
y_line_distance;
75
this
.jg.drawLine(
this
.start_x,y_item,
this
.start_x
+
this
.width,y_item);
76
var
y_v
=
Math.round(y_value_distance
*
(i
+
1
)
+
y_min);
77
this
.jg.drawString(y_v,
this
.start_x
-
this
.y_str_width,y_item);
78 }
79
for
(i
=
0
;i
<
x_length;i
++
)
80
{
81
this
.jg.setStroke(
-
1
);
82
this
.jg.setColor(
"
#000000
"
);
83
var
x_item_end
=
this
.start_x
+
x_line_distance
*
(i
+
1
);
84
this
.jg.drawLine(x_item_end,
this
.start_y
+
this
.height,x_item_end,
this
.start_y);
85
this
.jg.drawString(_x[i],x_item_end,
this
.start_y
+
this
.height
+
10
);
86 }
87
for
(i
=
y_length;i<
/**/
/*
************更多技术文章请访问:http://www.blogjava.net/JAVA-HE****************2
*3
* 文件名:line.js V 1.014
* 5
* 作 者:何昌敏6
*7
* 时 间:2007-78
*9
* 描 述:绘制坐标曲线图10
*11
* 备 注:12
* 1.实现了根据所提供数据,自动标刻y轴坐标。13
* 2.实现了图像清除。14
* 3.调整startx starty能实现整体位置调整。15
*16
* 感 谢:Walter Zorn提供了API ——wz_jsgraphics.js v. 3.01。17
* 18
*************更多技术文章请访问:http://www.blogjava.net/JAVA-HE***************
*/
19
20
function
Line(obj)21
{22
this
.jg
=
new
jsGraphics(obj); 23
var
colors
=
new
Array();24
colors[
0
]
=
"
#0066FF
"
;25
colors[
1
]
=
"
#FF6633
"
;26
colors[
2
]
=
"
#9900FF
"
;27
colors[
3
]
=
"
#FF0066
"
;28
colors[
4
]
=
"
#066600
"
;29
colors[
5
]
=
"
#006633
"
;30
colors[
6
]
=
"
#33FFFF
"
;31
colors[
7
]
=
"
#000000
"
;32
colors[
8
]
=
"
#FFFF00
"
;33
colors[
9
]
=
"
#000033
"
;34
colors[
10
]
=
"
#CCFFFF
"
;35
colors[
11
]
=
"
#666666
"
;36
this
.start_x
=
40
;
//
应大于等于y_str_width
37
this
.y_str_width
=
40
;
//
坐标系的左边距
38
this
.x_str_tom
=
10
;
//
x轴文字 距离坐标系底部距离。
39
this
.start_y
=
20
;
//
>=this.ArrowLength*2 箭头的高度
40
this
.width
=
200
;41
this
.height
=
120
;42
this
.y_line_num
=
5
;43
44
this
.IsDrawArrow
=
true
;45
this
.ArrowLength
=
6
;46
47
this
.drawXYLine
=
function
(_y,_x)48
{49
var
y_length
=
_y.length;50
var
x_length
=
_x.length;51
if
(y_length
!=
x_length)52
{53
alert(
"
X and Y length of inconsistencies, errors parameters.
"
);54
return
;55
}
56
var
y_line_distance
=
Math.round(
this
.height
/
this
.y_line_num);57
var
x_line_distance
=
Math.round(
this
.width
/
x_length);58
59
this
.jg.drawLine(
this
.start_x,
this
.start_y
+
this
.height,
this
.start_x
+
this
.width,
this
.start_y
+
this
.height);
//
x
60
this
.jg.drawLine(
this
.start_x,
this
.start_y
+
this
.height,
this
.start_x,
this
.start_y);
//
y
61
this
.jg.setStroke(Stroke.DOTTED); 62
var
_y_copy
=
_y.concat();63
var
temp
=
_y;64
temp.sort(
function
AscSort(x, y) 65
{66
return
x
==
y
?
0
: (x
>
y
?
1
:
-
1
);67
}
68
);69
var
y_max2y_min
=
temp[x_length
-
1
]
-
temp[
0
];70
var
y_min
=
temp[
0
];71
var
y_value_distance
=
y_max2y_min
/
this
.y_line_num;72
for
(
var
i
=
0
;i
<
this
.y_line_num;i
++
)73
{74
var
y_item
=
this
.start_y
+
this
.height
-
(i
+
1
)
*
y_line_distance;75
this
.jg.drawLine(
this
.start_x,y_item,
this
.start_x
+
this
.width,y_item);76
var
y_v
=
Math.round(y_value_distance
*
(i
+
1
)
+
y_min);77
this
.jg.drawString(y_v,
this
.start_x
-
this
.y_str_width,y_item);78
}
79
for
(i
=
0
;i
<
x_length;i
++
)80
{81
this
.jg.setStroke(
-
1
);82
this
.jg.setColor(
"
#000000
"
);83
var
x_item_end
=
this
.start_x
+
x_line_distance
*
(i
+
1
);84
this
.jg.drawLine(x_item_end,
this
.start_y
+
this
.height,x_item_end,
this
.start_y);85
this
.jg.drawString(_x[i],x_item_end,
this
.start_y
+
this
.height
+
10
);86
}
87
for
(i
=
y_length;i<
分享到:


发表评论

-
图象缓冲
2007-02-07 09:45 742图象缓冲的应用双缓冲绘图:<!--<br>& ... -
检验邮箱
2007-02-08 09:46 770<!--<br><br> ... -
批处理命令总结
2007-02-08 16:52 692批处理命令总结:@ 符号后 的命 ... -
学习UML笔记
2007-02-27 17:30 743学习 UML 笔记 前言 为了自己能快速将 UML ... -
blog加上一个同页面浏览者聊天室代码
2007-05-23 10:17 698都是用的别人提供的服务。哈哈。<script type= ... -
常见网页技巧
2007-06-10 16:32 5461.鼠标移动上去,图片变亮,移开又变成灰色。改变的是透明度。 ... -
javascript 数组排序
2007-07-01 03:16 713javascript 数组排序发现一个我原来不知道的事情: ... -
搭建php的运行环境
2007-07-31 18:50 870配置 php 环境 ... -
从网页导出excel
2007-08-09 21:36 704<?xml:namespace ... -
简单日期下拉框
2007-08-09 22:13 828项目中用到一个级联、动态下拉选择日期框。我以前也收集 ... -
php学习笔记1
2007-08-22 22:36 783前面总结过 ... -
php学习笔记2
2007-08-23 23:33 716主要内容:总结了第四章,主要关于字符串处理。参考书籍 ... -
分享一个表格排序程序
2007-08-23 23:46 639应广大网友要求特此分享一个表格排序的程序。有问题,欢迎留言(虽 ... -
AJAX愉快之旅——prototype.js篇
2007-08-24 09:53 586AJAX ... -
Javascript 事件转移
2007-09-19 08:52 720我遇到的Javascript 现 ... -
网页打印脚本
2007-09-19 08:55 1566<html><head><sty ... -
记录访问者IP
2007-09-19 10:46 827<?php //文件名字 $filename = &q ... -
JAVASCRIPT COOKIE初级指南
2007-12-23 23:43 6491、设置COOKIE数据: 最 ... -
PHP读取4种配置文件(php,ini,yaml,xml)
2007-12-23 23:49 824<?php/*** 读取4中配置的表信息,现支持php. ... -
JAVASCRIPT 与闭包
2007-12-23 23:57 597闭包和引用,this引用的简单介绍……<script t ...
相关推荐
javascript 在客户端绘制图表系列二
完全用javascript编写的绘制图表程序,没有采用额外的插件,可以绘制柱状图,折线图,饼状图等,适用于绘制简单图形。
JS绘制曲线图,Javascript 编写的绘制曲线图的源码
前端时间领导要做个demo需要绘制曲线图柱状图这些东西,要动态生成。我尝试着用javascript写了一下,后来才发现远没有我想象的简单,浏览器的兼容性能累死人的,出来的效果也不是很理想。后来让领导否据掉了,不能用...
•支持大部分的图表类型:直线图,曲线图、区域图、区域曲线图、柱状图、饼装图、散布图; •跨语言:不管是PHP、Asp.net还是Java都可以使用,它只需要三个文件:一个是Highcharts的核心文件highcharts.js,还有a ...
教你一天玩转JavaScript(三)——使用JavaScript完成图片轮播的效果
EveryChart是一个基于JavaScript的Web绘制图表工具,它的特点: 体积小,速度快,使用简单 面向对象架构,方便扩展 拥有详尽的中文文档和本土技术支持 不依赖其他框架,与jquery,mootools等兼容 支持动态增加改图 ...
JavaScript在客户端验证密码强度
使用JavaScript获取客户端的鼠标坐标信息
mxGraph是一个完整的客户端JavaScript图表库
https://blog.csdn.net/wan_lwj/article/details/52211128
Ervy - 在终端中绘制图表
javascript获取客户端网卡MAC地址和IP地址和计算机名
该代码为使用JavaScript绘制图表的一个范例,可以再次基础上继续编写需要的图表。
利用贝赛尔曲线函数在arcgis图层中绘制平滑曲线,通过地图上的几个控制点,在客户端绘制平滑曲线,可用于客户端绘制等值线
JavaScript使用canvas绘制坐标和线 本文实例为大家分享了JavaScript使用canvas绘制坐标和线的具体代码,供大家参考,具体内容如下 具体代码如下: <!DOCTYPE html> <html lang="en"> <head> ...
基于JavaScript的富客户端表格绘制库开发.pdf
看网上有不少相关的javascript客户端输入验证/限制的解决方案,汇总一下,分享。
vml+javascript直接在web页面绘制动态曲线